What kind of optimizations could we expect from the C# compiler and the JIT?
In this post, I would like to share a small, but helpful example of how the .NET compilers can help us to archive the best performance. Also, We will get in touch with some essential tools.
It is important to say that this example was inspired by the fantastic book keywords=.net+performance”>Writing high-performance .net applications.
The basics
When using .net, there are two different types of “compilation.” There are two compilers – Roslyn (if you are using C# and VB) and the JIT.
The first compilation occurs when we start the build process – from the source-code. It is different from what happens when using C++, for example. At this point, there is nothing “ready to run.”. The result of this process is a binary representation of our code expressed in an “Intermediate Language.”
The second compilation occurs when the program is executed. The JIT (Just In Time compiler), will generate the native code (from the IL) which is ready to run.
This approach is great. The JIT can generate the best native code as possible to the environment where your program needs to run. Also, it is easier to make it compatible.
Let’s write some code!
To make this process easier to understand, let start with a simple example. The following code calls a function two times. This function returns the result of adding two constants.
using System;
using System.Runtime.CompilerServices;

namespace UnderstandingJIT
{
    class Program
    {
        static void Main()
        {
            var a = TheAnswer();
            var b = TheAnswer();
            Console.WriteLine(a + b);
        }

        [MethodImpl(MethodImplOptions.NoInlining)]
        static int TheAnswer()
            => 21 + 21;
    }
}
The MethodImplOptions.NoInlining attribute instructs the JIT compiler to not perform an extremely common optimization. We will return to this later.
The resulting Intermediate Language
Like we know, the first compilation converts source code (in our case, C#), to an intermediate language.
The following code shows a text representation of this code. That representation was generated using the ILSpy tool.
.method private hidebysig static
	void Main () cil managed
{
	// Method begins at RVA 0x2050
	// Code size 19 (0x13)
	.maxstack 2
	.entrypoint
	.locals init (
		[0] int32 b
	)

	IL_0000: call int32 UnderstandingJIT.Program::TheAnswer()
	IL_0005: call int32 UnderstandingJIT.Program::TheAnswer()
	IL_000a: stloc.0
	IL_000b: ldloc.0
	IL_000c: add
	IL_000d: call void [mscorlib]System.Console::WriteLine(int32)
	IL_0012: ret
} // end of method Program::Main

.method private hidebysig static
	int32 TheAnswer () cil managed
{
	// Method begins at RVA 0x206f
	// Code size 3 (0x3)
	.maxstack 8

	IL_0000: ldc.i4.s 42
	IL_0002: ret
} // end of method Program::TheAnswer
IL is a canonical representation of dotNET. No matter what language you use (C#, VB or F#), in the end, we will always have IL.
We could use IL to write code directly. But, it is essential to understand that IL was not made to be practical. It is closer to the metal, not to the domain.
Inspecting the code, you can see that the compiler already did some optimizations. Right?
Debugging using WinDBG
Now, it is time to see the JIT compiler in action. To do that, let’s use WinDBG.
WinDBG is an excellent tool for Windows debugging (not limited to
WinDBG is powerful. Anyway, all this power is not free. Debugging with WinDBG is not easy when comparing with Visual Studio, for example. But, if you are a professional Windows Developer, and you need to deal with some complicated debugging scenarios, so you should spend some time learning at least the basics of how to use WinDBG.
Assuming that you have WinDBG on your computer, just load the executable generated by the Roslyn Compiler and then execute the following lines.
sxe ld clrjit
g
.loadby sos clr
!bpmd UnderstandingJIT.exe Program.Main
g
At this moment, we started running the application and paused it at the beginning of the Main method.
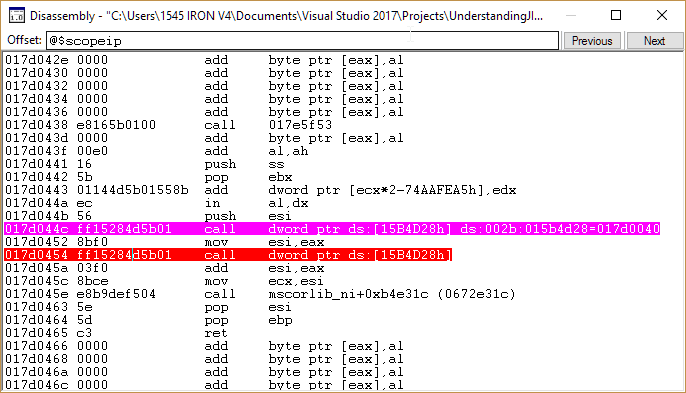
Here is the Main method in Assembly.
call dword ptr ds:[15B4D28h]
mov  esi, eax
call dword ptr ds:[15B4D28h]
add  esi, eax
mov  ecx, esi
call mscorlib_ni+0xbae32c
The first two call instructions are invoking the TheAnswer method. The third one is calling the Console.WriteLine method.
It is interesting to note that all the operations are using registers.
Executing one line at a time, when calling the TheAnswer we get something like that:
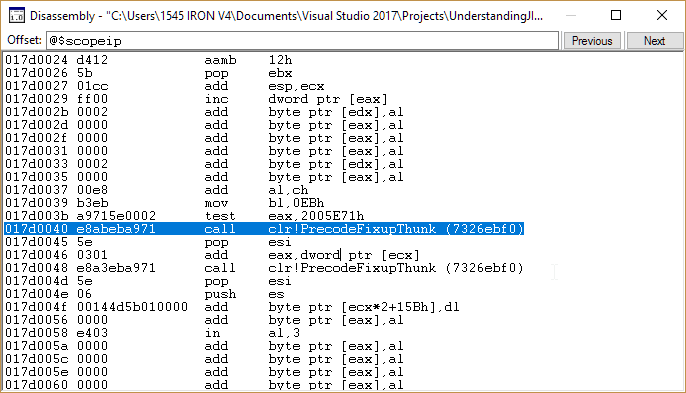
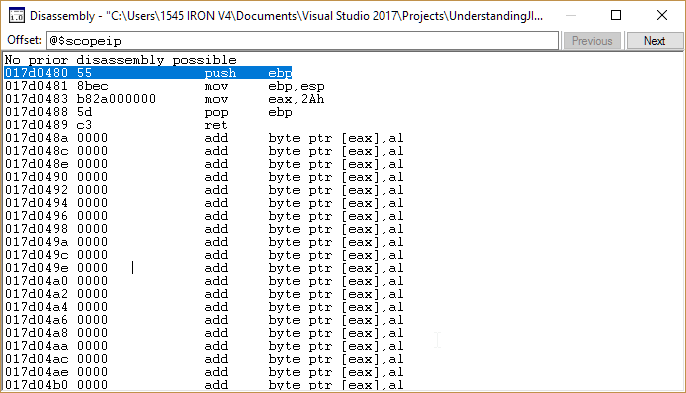
But, when running the second call, we get this:
It is interesting to note that all the operations are using registers.
Executing one line at a time, when calling the TheAnswer we get something like that.
What happened?
In .NET, the JIT compiler is executed in the “first execution” of each method. Whenever you run a method for the first time, this is the moment when the JIT will work on that method.
For the second time running the TheAnswer</em< method, there is no more compilation to do. So, we are ready to run.
push ebp
mov  ebp, esp
mov  eax, 2Ah
pop  ebp
ret
Note that 2Ah (hexadecimal) is 42 (decimal). The result value is stored on the EAX register.
To remember: The first time (and only the first time) running a method is when the JIT will convert it to native code (with a very little overhead).
Inlining
Previously, I said that the< code>MethodImplOptions.NoInlining prevents JIT to perform an important optimization. Let’s return to this topic.
Inlining is the name of a pretty ordinary optimization where the JIT replaces calls to functions with the code of that function. The resulting code is faster but bigger.
Let’s see what we get debugging the code with WinDBG after removing the code>MethodImplOptions.NoInlining attribute.
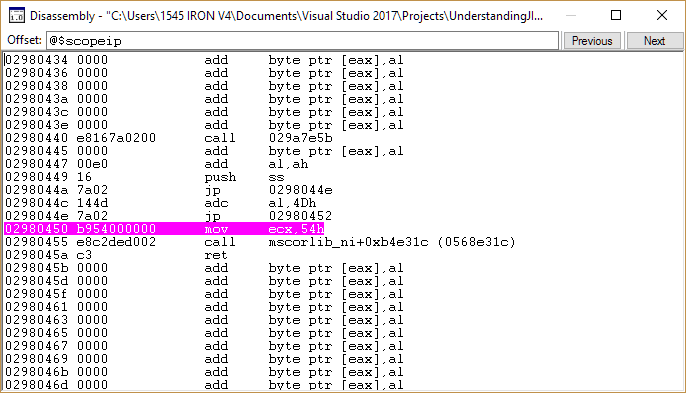
This is our new Main method.
mov  ecx, 54h
call mscorlib_ni+0xb4e31c
ret
What happened? JIT knows that TheAnswer returns a constant. So, instead of doing an expensive operation (calling a method), JIT just used the result. The next logical step was to do the add in the compilation time. Now, all our code do is call Console.WriteLine method passing 54h (84 decimal).
Beautiful.


